5 Best Stocks to Buy Today
| Company (Ticker) | 12 Week Price Change | Forward PE | Price | Proj EPS Growth (1 Year) | Projected Sales Growth (1Y) |
|---|---|---|---|---|---|
| Ciena (CIEN) | 57.35% | 45.65 | $233.87 | 97.78% | 21.44% |
| Transportadora De Gas Ord B (TGS) | 49.23% | 16.15 | $31.09 | -21.52% | 11.25% |
| Alcoa (AA) | 53.05% | 15.25 | $53.14 | 164.20% | 7.36% |
| Impala Platinum (IMPUY) | 24.73% | 12.02 | $15.68 | 2,560.00% | 0.00% |
| BUNGE GLOBAL SA (BG) | 6.74% | 11.96 | $89.08 | -18.39% | 29.11% |
*Updated on January 1, 2026.
Ciena (CIEN)
$233.87 USD -4.49 (-1.88%)
3-Year Stock Price Performance

Premium Research for CIEN
- Zacks Rank
 Strong Buy 1
- Style Scores
D Value A Growth A Momentum A VGM
- Market Cap:$34.04 B (Large Cap)
- Projected EPS Growth:95.08%
- Last Quarter EPS Growth:56.10%
- Last EPS Surprise:18.18%
- Next EPS Report date:March 10, 2026
Our Take:
Ciena provides optical networking equipment and software for carriers, cloud providers and large enterprises. A Zacks Rank #1 (Strong Buy) signals rising estimates. Style Scores of A for Growth and D for Momentum and Value indicate a mix that often favors near-term earnings improvement while price catches up.
Fundamentally, demand from hyperscalers for data-center interconnect and coherent optics remains the core driver, despite near-term NPI and input cost pressures. Management has highlighted record direct cloud revenue and robust AI-related networking spend, while WaveLogic 6 deployments extend Ciena’s speed and efficiency edge in long-haul and metro networks.
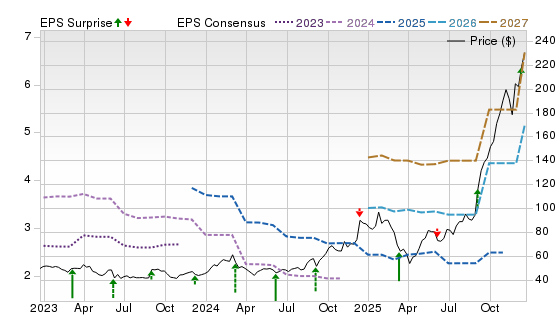
On the Price, Consensus & EPS Surprise chart, price has turned higher alongside rising 2026–2027 consensus lines, indicating improving estimate momentum after a volatile 2024–2025 stretch. With secular AI and cloud networking demand, the setup looks favorable if execution on cloud wins and 1.6T WAN solution coherent rollouts continue.
See more from Zacks Research for This Ticker
Normally $25 each - click below to receive one report FREE:
Transportadora De Gas Ord B (TGS)
$31.09 USD +0.17 (0.55%)
3-Year Stock Price Performance

Premium Research for TGS
- Zacks Rank
 Buy 2
Buy 2
- Style Scores
B Value C Growth C Momentum B VGM
- Market Cap:$4.68 B (Mid Cap)
- Projected EPS Growth:-21.31%
- Last Quarter EPS Growth:143.48%
- Last EPS Surprise:833.33%
- Next EPS Report date:Feb. 26, 2026
Our Take:
TGS operates Argentina’s regulated natural-gas transportation network and runs midstream, natural-gas liquids and telecom units. A Zacks Rank #1 underscores favorable estimate revisions, while Style Scores of C for Value, D for Growth and B for Momentum suggest a catalyst-driven, not valuation-only, case.
Strategically, expansion around the Vaca Muerta shale, combined with tariff resets and a multi-year investment plan, supports cash flow visibility in core transportation, while midstream and NGLs add upside. Argentina already approved capacity expansions tied to Vaca Muerta, and TGS has outlined spending and tariff proposals for the coming few years to underpin service reliability.
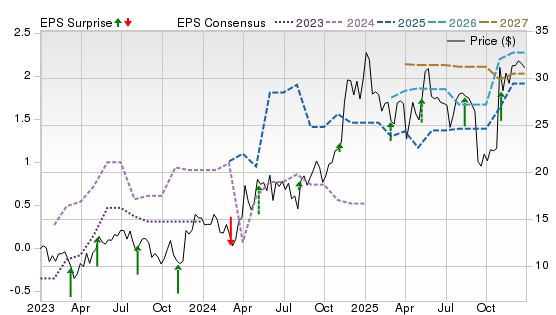
On the chart, the stock’s recovery coincides with a turn up in outer-year consensus after a trough, a constructive sign that revisions are stabilizing. With pipeline growth optionality, TGS offers leverage to Argentina’s gas development, while investors should monitor regulatory timing and FX risk.
See more from Zacks Research for This Ticker
Normally $25 each - click below to receive one report FREE:
Alcoa (AA)
$53.14 USD -1.24 (-2.28%)
3-Year Stock Price Performance

Premium Research for AA
- Zacks Rank
 Strong Buy 1
- Style Scores
B Value F Growth B Momentum D VGM
- Market Cap:$14.05 B (Large Cap)
- Projected EPS Growth:164.44%
- Last Quarter EPS Growth:-105.13%
- Last EPS Surprise:86.67%
- Next EPS Report date:Jan. 22, 2026
Our Take:
Alcoa is a vertically integrated aluminum producer with upstream bauxite and alumina operations, as well as a primary smelting business. A Zacks Rank #1, alongside Style Scores of B for Value and Momentum and F for Growth, points to improving expectations and reasonable entry valuation despite uneven growth optics.
As smelter restarts progress, volume and long-term cost competitiveness are expected to improve, even if near-term restart costs weigh on its results. Aluminum remains tied to energy-transition end-markets such as EVs, grid and aerospace, sustaining structural demand. The upcoming Indonesian smelting capacity addition will support demand growth, partially offset by Mozal smelter uncertainty.
On the chart, price has rebounded from 2024 lows as 2026–2027 consensus estimates edge higher, reflecting improving operations and restart cadence. With estimate momentum and operating leverage to aluminum pricing, AA’s setup looks constructive, acknowledging power and commodity-cycle sensitivities.
See more from Zacks Research for This Ticker
Normally $25 each - click below to receive one report FREE:
Impala Platinum (IMPUY)
$15.68 USD -0.31 (-1.94%)
3-Year Stock Price Performance

Premium Research for IMPUY
- Zacks Rank
 Strong Buy 1
- Style Scores
C Value D Growth F Momentum D VGM
- Market Cap:$15.08 B (Large Cap)
- Projected EPS Growth:2,560.00%
- Last Quarter EPS Growth:NA
- Last EPS Surprise:NA
- Next EPS Report date:NA
Our Take:
Impala Platinum or Implats mines and processes platinum-group metals across South Africa, Zimbabwe and Canada. A Zacks Rank #1 offsets weak Style Scores of D for Value, Growth and Momentum, indicating positive estimate revisions despite a mixed factor profile. It intends to achieve carbon neutrality by 2050, and the company is executing Renewable energy agreements to reach there.
Processing constraints from Rustenburg furnace repairs are easing, and management is prioritizing discipline while industry supply tightness and platinum’s improving backdrop support pricing. Recent releases outline furnace rebuilds and operating optimization. Its updated capex plan is likely to counter the volatility in the rand PGM price environment.
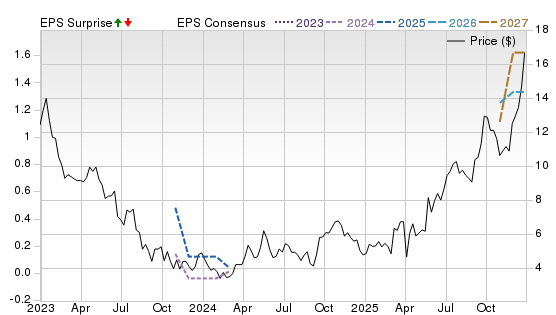
The chart shows a decisive price uptrend with sharply rising outer-year consensus, consistent with rebuilding throughput and a firmer PGM tape. With operational normalization, Implats offers leveraged exposure to platinum, while investors should expect commodity-driven swings.
See more from Zacks Research for This Ticker
Normally $25 each - click below to receive one report FREE:
BUNGE GLOBAL SA (BG)
$89.08 USD -0.60 (-0.67%)
3-Year Stock Price Performance

Premium Research for BG
- Zacks Rank
 Strong Buy 1
- Style Scores
A Value D Growth C Momentum B VGM
- Market Cap:$17.22 B (Large Cap)
- Projected EPS Growth:-18.39%
- Last Quarter EPS Growth:73.28%
- Last EPS Surprise:1.79%
- Next EPS Report date:Feb. 4, 2026
Our Take:
Bunge is a global agribusiness handling origination, trading and processing of grains and oilseeds. A Zacks Rank #1, with Style Scores of A for Value and Momentum and D for Growth, suggests reasonable valuation with improving sentiment.
The strategic catalyst is the completed Viterra merger, which broadens origination, storage and export capacity and enhances scale across oilseeds and grains. Bunge also has a renewable-feedstock platform with Chevron and Corteva that positions it for biofuel demand, an offset to cyclical crush margins. Its Soybean Processing and Refining unit is witnessing rising profits thanks to higher margins and strong execution. The increased production capacity in Argentina will support higher volumes.
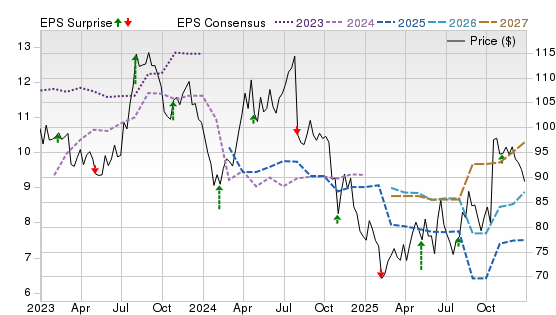
On the chart, price resilience and gradually improving outer-year consensus align with integration progress after a soft margin period. With scale from Viterra and renewable-feedstock exposure, BG screens as a balanced agribusiness compounder.
See more from Zacks Research for This Ticker
Normally $25 each - click below to receive one report FREE:
Best Stocks to Buy Now: How to Use This List
It’s important to understand what this list is, and what it isn’t.
For decades, the Zacks Rank has been a proven system that has helped investors identify stocks most likely to outperform. Instead of relying on hunches or hype, it’s grounded in earnings estimate revisions — a factor strongly correlated with stock price movement. When combined with additional fundamental metrics, the approach becomes even more powerful.
Still, it’s important to understand these basics:
- While the list offers exposure across several industries, it is not a fully diversified portfolio. You should think of it as a starting point, not a complete investing strategy.
- Even though these stocks are backed by a proven system, nothing protects you from short-term downside. Depending on market conditions, most — or even all — could decline in the near term.
- The Zacks Rank works because it captures trends in earnings momentum. That power plays out over weeks and months, not days. Investors with patience and discipline are more likely to benefit.
- Before buying any single stock, check how it aligns with your goals, risk tolerance, and broader portfolio.
Methodology
The Zacks Rank is a proprietary stock-rating model that uses trends in earnings estimate revisions and earnings-per-share (EPS) surprises to classify stocks into five groups: #1 (Strong Buy), #2 (Buy), #3 (Hold), #4 (Sell) and #5 (Strong Sell). The Zacks Rank is calculated through four primary factors related to earnings estimates: analysts' consensus on earnings estimate revisions, the magnitude of revision change, the upside potential and estimate surprise (or the degree in which earnings per share deviated from the previous quarter).
Zacks builds the data from 3,000 analysts at over 150 different brokerage firms. The average yearly gain for Zacks Rank #1 (Strong Buy) stocks is +23.62% per year from January, 1988, through June 2, 2025.
For this list, only companies in the top 50% of industries that have average daily trading volumes of 100,000 shares or more were considered. Stocks with a share value of $5 or less were excluded. These companies earned Zacks Rank #1 (Strong Buy) between Dec. 8 and Dec. 20, 2025. All information is current as of market open, Dec. 29, 2025.
Common Questions of New Investors
Where to Buy Stocks
To invest in stocks, you must open a brokerage account, fund the account and purchase stocks through your selected brokerage. Investors may also purchase stocks through a financial advisor or an automated robo advisor. Some publicly traded companies also offer a direct stock purchase plan, where you can purchase shares directly from the company.
Alternative Ways to Invest in Stocks
You can also invest in stock funds, such as mutual funds, index funds and exchange-traded funds, where the fund managers select the pool of stocks that follow an investing strategy. These funds may broadly cover an entire index, such as the S&P 500, or specific types of stocks, such as industries like technology and energy companies, company size such as small cap companies, or location like international companies.
How to Start Investing in Stocks Today
It’s easy to start investing by opening an online brokerage account. Opening a standard brokerage account takes about 20 minutes and you’ll need to have some personal information ready, such as your social security number and your bank details to fund your account.
You’ll need to decide whether to open a taxable account (most common), a tax-deferred retirement account such as a traditional IRA or a tax-free retirement account such as a Roth IRA, which is funded with after-tax dollars, but qualified withdrawals are tax-free. A margin account allows for borrowing to purchase stocks and is best for experienced traders.
Set goals before you begin investing – determine how much you can afford to invest and your tolerance for risk.
What to Look for When You Buy Stocks?
The goal in all equities investment is to buy low and sell high, growing your wealth over time. Researching the companies to invest in is key – what kind of product or service do they offer? How do they compare with competitors? How fast are they growing? Does the stock pay regular dividends to shareholders? Does the stock help diversify your portfolio by giving you exposure to a market segment you currently don’t hold?
Understanding fundamental analysis can help determine whether the stock has the potential for growth at its current purchase price. Factors that can help determine that include earnings per share (EPS), price-to-earnings ratio and PE growth. Technical analysis is used looking at statistical patterns to potentially predict future price moves. Some investors may look for a growth and income strategy, looking for stocks with solid revenues that pay good dividends, or a value strategy, looking if a current stock price is below what their revenue, EPS and other factors suggest.
Analysts also often look for the momentum of a stock by looking at moving averages of a stock's closing price over a 50-day, 100-day or 12-month trailing time period to determine signals whether to buy or sell a stock.


